Puerto Rico and its Diaspora
César J. Ayala
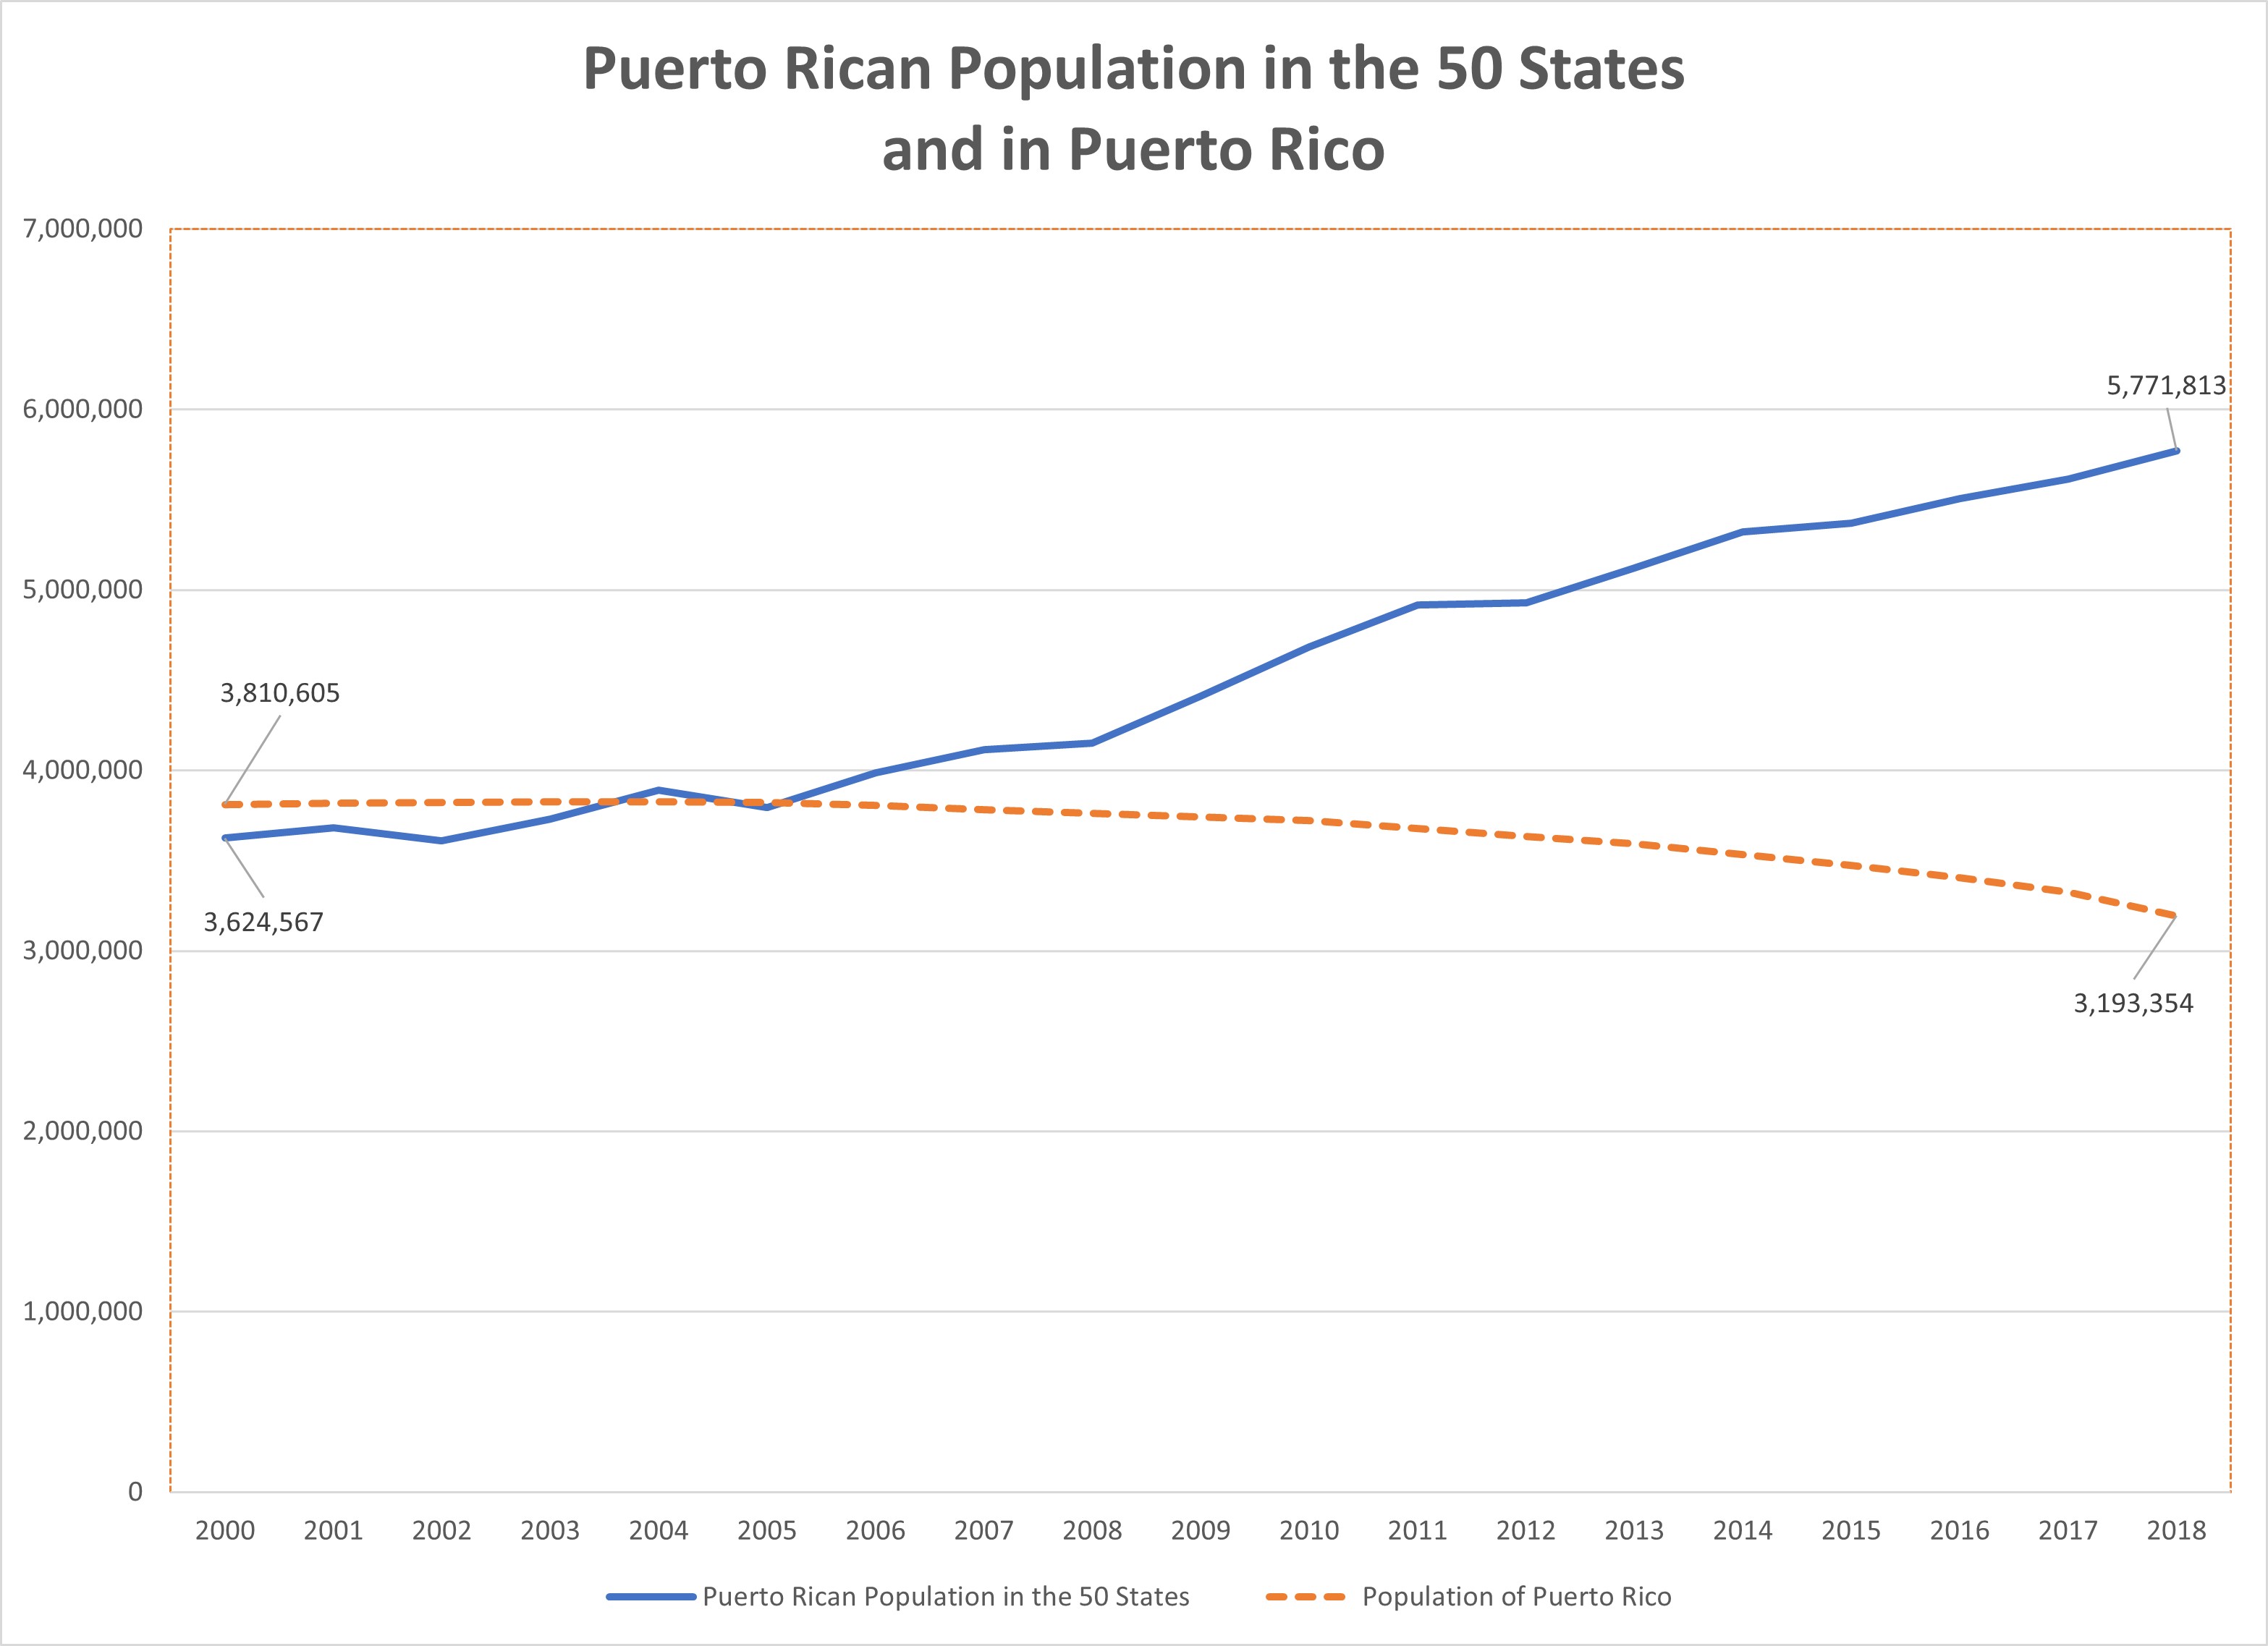
In 2018, 64 percent of all Puerto Ricans lived in the 50 states and in the District of Columbia, while the remaining 36 percent lived in Puerto Rico. At the turn of the 21st century, the population of Puerto Rico was still slightly larger than the Puerto Rican population stateside. The Puerto Rican population in the continental United States surpassed that of the Island in 2006, the same year in which the 936 tax exemptions to industry expired in Puerto Rico, accelerating the exodus propelled by the loss of manufacturing jobs. The tax exemptions to industry provided by section 936 of the U.S Internal Revenue Code were phased out gradually during 1996-2006, causing a catastrophic drop in manufacturing employment in Puerto Rico.
Source: Economic Research Division, Federal Reserve Bank of St. Louis ( https://fred.stlouisfed.org )
The Puerto Rican economy, which was never able to provide enough employment to the population throughout the 20th century, began to collapse as a result of the elimination of section 936. By the time the population figures of the 2020 Census are released, in all probability two thirds of Puerto Ricans will be located stateside, one third in the Island. At present, the Puerto Ricans are a diasporic people.
The increase in the Puerto Rican population in the continent happened simultaneously with an absolute decrease of the population of the Island. Puerto Rico had more population in 2000 than it has today. The great exodus of the last two decades differs from the migration of Puerto Ricans in the 1950s in that the previous migratory wave did not produce an absolute decline of the population, but rather a slowdown of the increase in population in the Island. There was positive population growth despite the large number of Puerto Ricans that left for the United States every year. In the current wave, however, the exodus is compounded by the decline in natality rates, resulting in the shrinkage of the population from 3,810,605 inhabitants in 2000 to 3,193,354 in 2018, a reduction of 16%. One could say that one of every six inhabitants has left the Island. |
||||||||||||||||||||||||||||||||||||||||||||||||||||||||||||||||||||||||||||||||||||||||||||||||||||||||||||||||||||||||||||||||||||||||||||||||||||||||||||||||||||||||||||||||||||||||||||||||||||||||||||||||||||||||||||||||||||||||||||||||||||||||||||||||||||||||||||||||||||||||||||||||||||||
State |
Puerto Rican Population |
Hispanic Population |
State Population |
% Hispanic |
| Alabama | 23,954 |
211,522 |
4,887,871 |
4.33% |
| Alaska | 8,941 |
53,129 |
737,438 |
7.20% |
| Arizona | 64,738 |
2,266,801 |
7,171,646 |
31.61% |
| Arkansas | 8,942 |
230,516 |
3,013,825 |
7.65% |
| California | 227,730 |
15,540,503 |
39,557,045 |
39.29% |
| Colorado | 36,864 |
1,234,409 |
5,695,564 |
21.67% |
| Connecticut | 296,363 |
590,265 |
3,572,665 |
16.52% |
| Delaware | 24,370 |
92,034 |
967,171 |
9.52% |
| District of Columbia | 6,160 |
79,112 |
702,455 |
11.26% |
| Florida | 1,171,637 |
5,562,411 |
21,299,325 |
26.12% |
| Georgia | 100,923 |
1,020,035 |
10,519,475 |
9.70% |
| Hawaii | 48,045 |
152,174 |
1,420,491 |
10.71% |
| Idaho | 8,037 |
222,788 |
1,754,208 |
12.70% |
| Illinois | 205,838 |
2,209,442 |
12,741,080 |
17.34% |
| Indiana | 36,824 |
472,523 |
6,691,878 |
7.06% |
| Iowa | 5,969 |
191,295 |
3,156,145 |
6.06% |
| Kansas | 15,850 |
348,487 |
2,911,510 |
11.97% |
| Kentucky | 16,372 |
162,562 |
4,468,402 |
3.64% |
| Louisiana | 15,618 |
239,522 |
4,659,978 |
5.14% |
| Maine | 4,970 |
21,981 |
1,338,404 |
1.64% |
| Maryland | 63,765 |
628,771 |
6,042,718 |
10.41% |
| Massachusetts | 329,532 |
846,965 |
6,902,197 |
12.27% |
| Michigan | 43,381 |
514,572 |
9,995,915 |
5.15% |
| Minnesota | 14,090 |
303,033 |
5,611,179 |
5.40% |
| Mississippi | 9,964 |
86,846 |
2,986,530 |
2.91% |
| Missouri | 15,417 |
250,823 |
6,126,452 |
4.09% |
| Montana | 1,801 |
41,861 |
1,062,305 |
3.94% |
| Nebraska | 4,466 |
215,117 |
1,929,268 |
11.15% |
| Nevada | 27,230 |
880,946 |
3,034,392 |
29.03% |
| New Hampshire | 17,612 |
52,730 |
1,356,410 |
3.89% |
| New Jersey | 480,950 |
1,839,293 |
8,908,520 |
20.65% |
| New Mexico | 11,206 |
1,028,967 |
2,095,428 |
49.11% |
| New York | 1,082,631 |
3,751,124 |
19,542,209 |
19.19% |
| North Carolina | 115,449 |
994,267 |
10,383,620 |
9.58% |
| North Dakota | 3,710 |
26,902 |
760,077 |
3.54% |
| Ohio | 139,068 |
451,625 |
11,689,442 |
3.86% |
| Oklahoma | 17,057 |
429,376 |
3,943,079 |
10.89% |
| Oregon | 14,230 |
556,075 |
4,190,713 |
13.27% |
| Pennsylvania | 472,213 |
971,762 |
12,807,060 |
7.59% |
| Rhode Island | 54,363 |
168,741 |
1,057,315 |
15.96% |
| South Carolina | 43,183 |
294,312 |
5,084,127 |
5.79% |
| South Dakota | 3,052 |
34,274 |
882,235 |
3.88% |
| Tennessee | 41,182 |
373,116 |
6,770,010 |
5.51% |
| Texas | 213,809 |
11,366,730 |
28,701,845 |
39.60% |
| Utah | 14,782 |
449,757 |
3,161,105 |
14.23% |
| Vermont | 1,666 |
12,094 |
626,299 |
1.93% |
| Virginia | 105,770 |
813,560 |
8,517,685 |
9.55% |
| Washington | 36,776 |
969,851 |
7,535,591 |
12.87% |
| West Virginia | 3,083 |
24,536 |
1,805,832 |
1.36% |
| Wisconsin | 61,437 |
403,183 |
5,813,568 |
6.94% |
| Wyoming | 793 |
57,553 |
577,737 |
9.96% |
| USA | 5,771,813 |
59,740,273 |
327,167,439 |
18.26% |
Source: U.S. Census Bureau.
Actualización 2-3-2021
© César J. Ayala 2020
| Puerto Rico: un pueblo diaspórico | Despoblamiento de Puerto Rico | Caída de la población escolar |
|---|---|---|
| Plaza Pública Virtual | Descenso de la Población Menor de 18 Años | Ingresos |
| Puerto Rico Natural Disasters | ||