The Puerto Rican Population of ArizonaCésar J. Ayala (Department of Sociology, UCLA) Nov 21, 2020 The Puerto Rican population in Arizona increased from 17, 726 in 2000 to 35,177 in 2010 and 49,739 in 2019. [1]
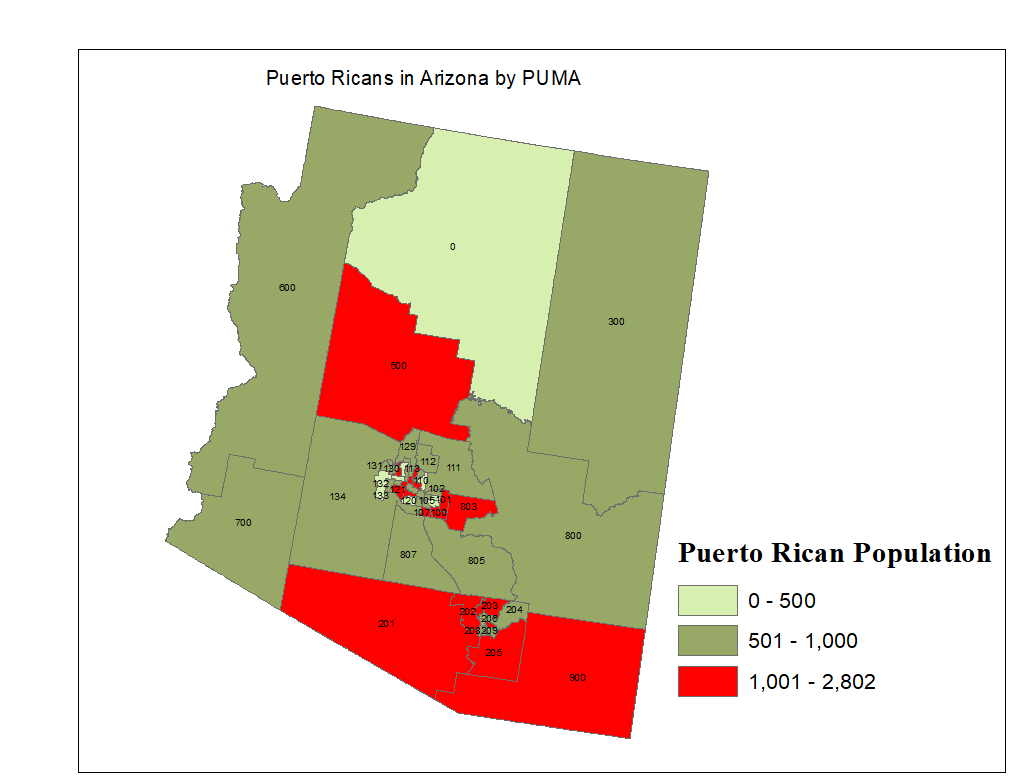
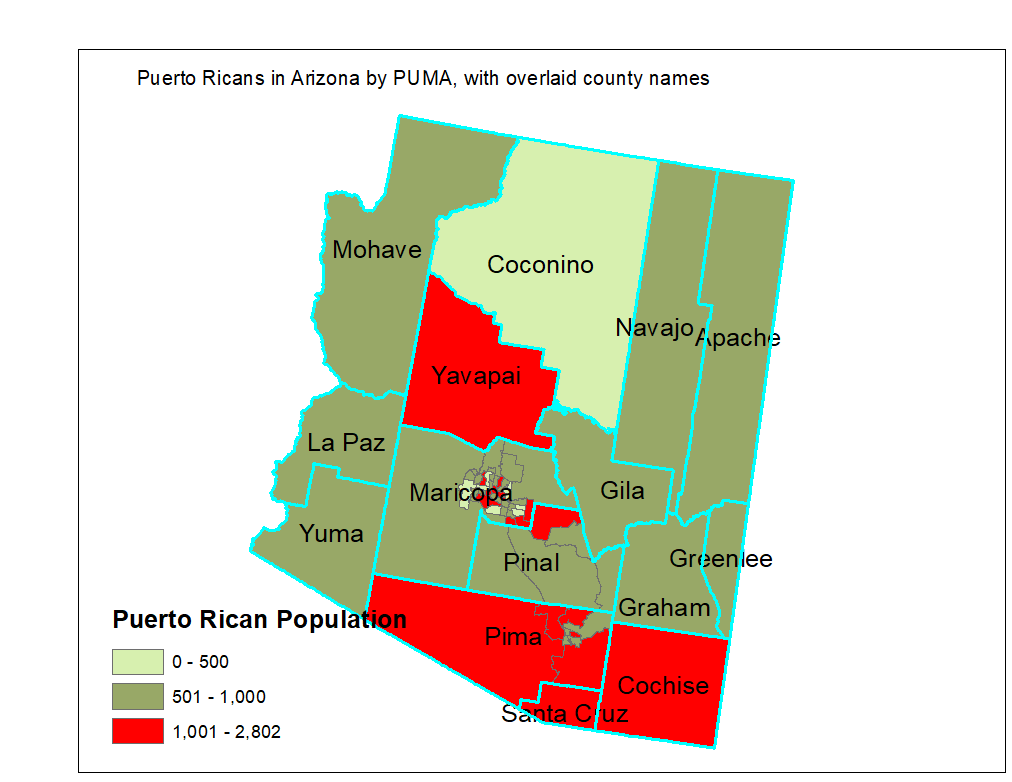
Although there are Puerto Ricans everywhere throughout the state, the overwhelming majority are concentrated in four counties. Maricopa County has 31,265, Pima County has 10,477, Yavapay has 1,080, and Yuma County has 815. The remaining counties have smaller populations which together add up to 6,102 boricuas throughout the state.  The most detailed data gives information on the population by "Public Use Microdata Area" (PUMA), a unit whih is sometimes smaller than a county, sometimes larger than a county. For example, in less populous regions, such as Navajo and Apache counties, one single PUMA spans two counties, whereas inside the most populous counties, such as Maricopa, there are multiple PUMAS within the county. Due to this limitation in the data, I am reporting the population by PUMA.
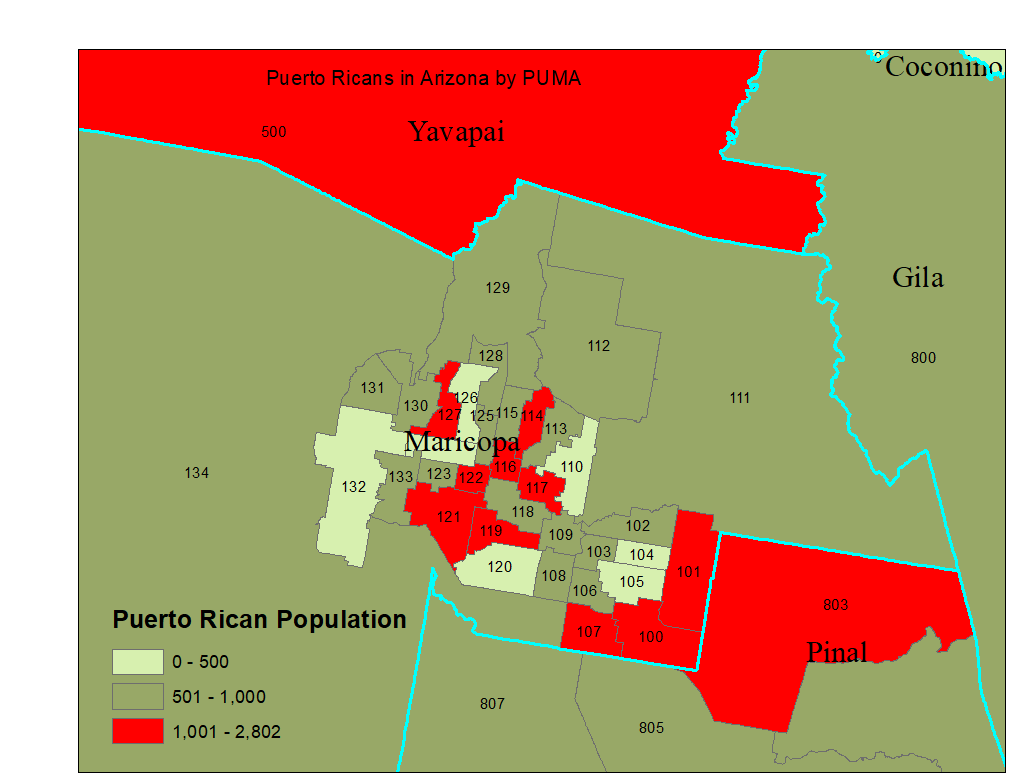
Overlaying the contours of the counties, we can see that Maricopa has many PUMAS within it and that the Puerto Rican population is concentrated there.
Within Maricopa County, there are at least 9 PUMAs with at least 1,000 Puerto Ricans each. One PUMA in Pinal county (803, Pinal County (North)--Apache Junction City PUMA ) has over one thousand Puerto Ricans, and it is contiguous with PUMAS 101(Maricopa County--Mesa City East) and 100 ( Maricopa County--Gilbert (South) & Queen Creek Towns PUMA, which also have over 1,000 Puerto Ricans.
GROWTH OF THE PUERTO RICAN POPULATIONThe Puerto Rican population of Arizona almost tripled between the years 2000 and 2019. This represents a very rapid growth. Nevertheless, in absolute terms, the Puerto Rican population is still less than one percent of the population of Arizona. The Growth of the Hispanic population in the state has also been impressive. The Mexican population increased from slightly over a million to over two million in the period 2000-2019. Other Hispanic poplations grew more slowly, from 189,210 to 226,443, an increase of 20% in a twenty year period. Hispanics a a whole increased from being a qarter of the population of the state to being a third of the population of the state in 2019. POPULATION OF ARIZONA
BIRTHPLACELess than 15% of the Puerto Rican population of Arizona was born in the Island of Puerto Rico. The most common place of birth is Arizona, and this probably represents the children of this rapidly growing community, followed by Puerto Rico, California, New York, Pennsylvania, Illibois and New Jersey. Of Puerto Ricans born abroad, Germany is the common country of birth, followed by Canada and Korea. Those born in Germany and Korea are probably tthe children of military families. PUERTO RICAN POPULATION OF ARIZONA BY BIRTHPLACE
[1] All data is from IPUMS (https://usa.ipums.org/usa/) and IPUMS-National Historic Geographic Information System (https://www.nhgis.org/).
|
|||||||||||||||||||||||||||||||||||||||||||||||||||||||||||||||||||||||||||||||||||||||||||||||||||||||||||||||||||||||||||||||||||||||||||||||||||||||||||||||||||||||||||||||||||||||||||||||||||||||||||||||||||||||||||||||||||||||||||||||||||||||||||||||||||||||||||||||||||||||||||||||||||||||||||||||||||||||||||||||||||||||||||||||||||
|---|---|---|---|---|---|---|---|---|---|---|---|---|---|---|---|---|---|---|---|---|---|---|---|---|---|---|---|---|---|---|---|---|---|---|---|---|---|---|---|---|---|---|---|---|---|---|---|---|---|---|---|---|---|---|---|---|---|---|---|---|---|---|---|---|---|---|---|---|---|---|---|---|---|---|---|---|---|---|---|---|---|---|---|---|---|---|---|---|---|---|---|---|---|---|---|---|---|---|---|---|---|---|---|---|---|---|---|---|---|---|---|---|---|---|---|---|---|---|---|---|---|---|---|---|---|---|---|---|---|---|---|---|---|---|---|---|---|---|---|---|---|---|---|---|---|---|---|---|---|---|---|---|---|---|---|---|---|---|---|---|---|---|---|---|---|---|---|---|---|---|---|---|---|---|---|---|---|---|---|---|---|---|---|---|---|---|---|---|---|---|---|---|---|---|---|---|---|---|---|---|---|---|---|---|---|---|---|---|---|---|---|---|---|---|---|---|---|---|---|---|---|---|---|---|---|---|---|---|---|---|---|---|---|---|---|---|---|---|---|---|---|---|---|---|---|---|---|---|---|---|---|---|---|---|---|---|---|---|---|---|---|---|---|---|---|---|---|---|---|---|---|---|---|---|---|---|---|---|---|---|---|---|---|---|---|---|---|---|---|---|---|---|---|---|---|---|---|---|---|---|---|---|---|---|---|---|---|---|---|---|---|---|---|---|---|---|---|---|---|---|---|---|---|---|---|---|---|---|---|---|---|---|---|---|---|---|---|---|---|

